Menu “View”
Graphical View

 Multi-selection : Select multiple machines simultaneously with a selection polygon drawn by the user (click around machines and double click to close the contour).
 Delete object : Deletes an item. In the graphical view, it is only possible to delete a virtual cell.
 Show/Hide empty machines : Allows you to hide or display machines that are not used.
 Connect/Disconnect the machines : Hide or display the flows passing between machines.
 Prevent collision : Prevents two machines from overlapping.
 Free machines : Allows machines no longer be locked within the cell in which they are located.
 Add IN/OUT : Adds an input / output to a virtual cell by double-clicking on one of the edges of the cell.
 Lock/Unlock machine : Will lock a machine. This machine can therefore cannot be moved.
 Add virtual cell : Adds a virtual cell which takes the form of an expandable rectangle. These virtual cells will define product families.
 Show ProdByCell tab : Displays the table containing the products associated with each virtual cell.
Blueprint View - Interaction Mode

- Delete object : Deletes an object. Within the “real” view in interaction mode, it is only possible to remove input / output points.
 Show/Hide background : Can hide or display the background image that was selected.
 Show/Hide machine panel : Can hide or display the tray containing the machines do not currently located within the plant.
- Show/Hide empty machines : Allows you to hide or display machines that are not used..
- Connect/Disconnect the machines : Allows you to position the machines on the plan without them connected to a flow. Interesting option when the refresh is too slow. At the end of the placement of all machines, return to “Connect” position to bring the situation to date.
- Prevent collision : Prevents two machines from overlapping.
- Lock/Unlock machine : Will lock a machine. This machine can therefore cannot be moved.
 Rotate machine : Enables the rotation of a machine.
 Visualization : Allows to choose between different vizualisation of the traffic.
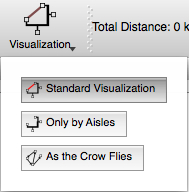
Visualization by aisle : No direct connection between machines. All traffic go through the aisles.
Visualization as crowfly : All machines are connected via a direct connection. This visualization allow the directional traffic.
Blueprint View - Design Mode

 Move element : Move an object
- Delete object : Allows deletion of an object or multiple (the Ctrl / Cmd key) objects selected.
 Add background : Allows adding a background image to trace the factory plan.
 Set scale : Changes the scale of the factory. The user can draw a line (click on each end) and define it’s length in meters.
 Create zone : Allows the creation of an area (Site, Building, Floor or Area) a polygon that the user will be able to draw. Click on the map to locate the contour points. To close the box, double-click on the last point of the contour. There is no need to double click on the first point. If the area is within a parent zone (first point in a parent area), it will automatically be truncated so that their boundaries correspond to the latter.
 Create cells : Allows the creation of a cell represented by a polygon within an area. Only that area may contain cell machinery. If the cell is within a parent zone, it will automatically be truncated so that their boundaries correspond to the latter. It is not useful to follow the contour of the plant with precision.
=>
 Add skeleton point : Adds a skeleton point by double-clicking on the selected area. If other points are already in this area, the connection between these points, if it is possible (line internal connection to the comings and not “too close” to the corners of the cells) will happen automatically.
 Add skeleton line : Allows you to manually add a skeleton line by double-clicking on the two points that compose it.
- Add IN/OUT : Adds an input / output to an area by double-clicking on one of the edges of this area.
 View skeleton : Displays the diagram with interconnections. This graph is the basis for the traffic display.